AI UX audit

    AI UX audit for websites and app flows

    Find potential usability and conversion issues in minutes. Flowyce reviews your pages with proven UX methods, shows the evidence behind every finding, and helps you decide what to fix first.

    See a sample report

    30 days · No credit card

    What it checks

    Four ways to audit your UX

    Pick the audit that fits the question you need answered.

    UX & conversion scorecard

    Scores positioning clarity, trust, conversion path, lead capture and traffic readiness against a versioned rubric, with mobile and desktop PageSpeed data.

    UX SCORECARD

    Broad review result

    77th percentile · SaaS

    OVERALL SCORE

    73/100

    A strong foundation with identifiable conversion friction.

    Conversion impact projection

    Medium confidence

    CURRENT STATE

    Score73/100
    Est. conversion rate4.5%

    PROJECTED STATE

    Score85/100
    Est. conversion rate4.77%

    Potential conversion-rate lift

    +0.27 pts

    5,000 simulations

    All data, scores, charts and findings shown in this section are illustrative examples generated for demonstration purposes only. They do not represent actual client results and do not constitute a guarantee of any future performance or outcome.

    Heuristic evaluation

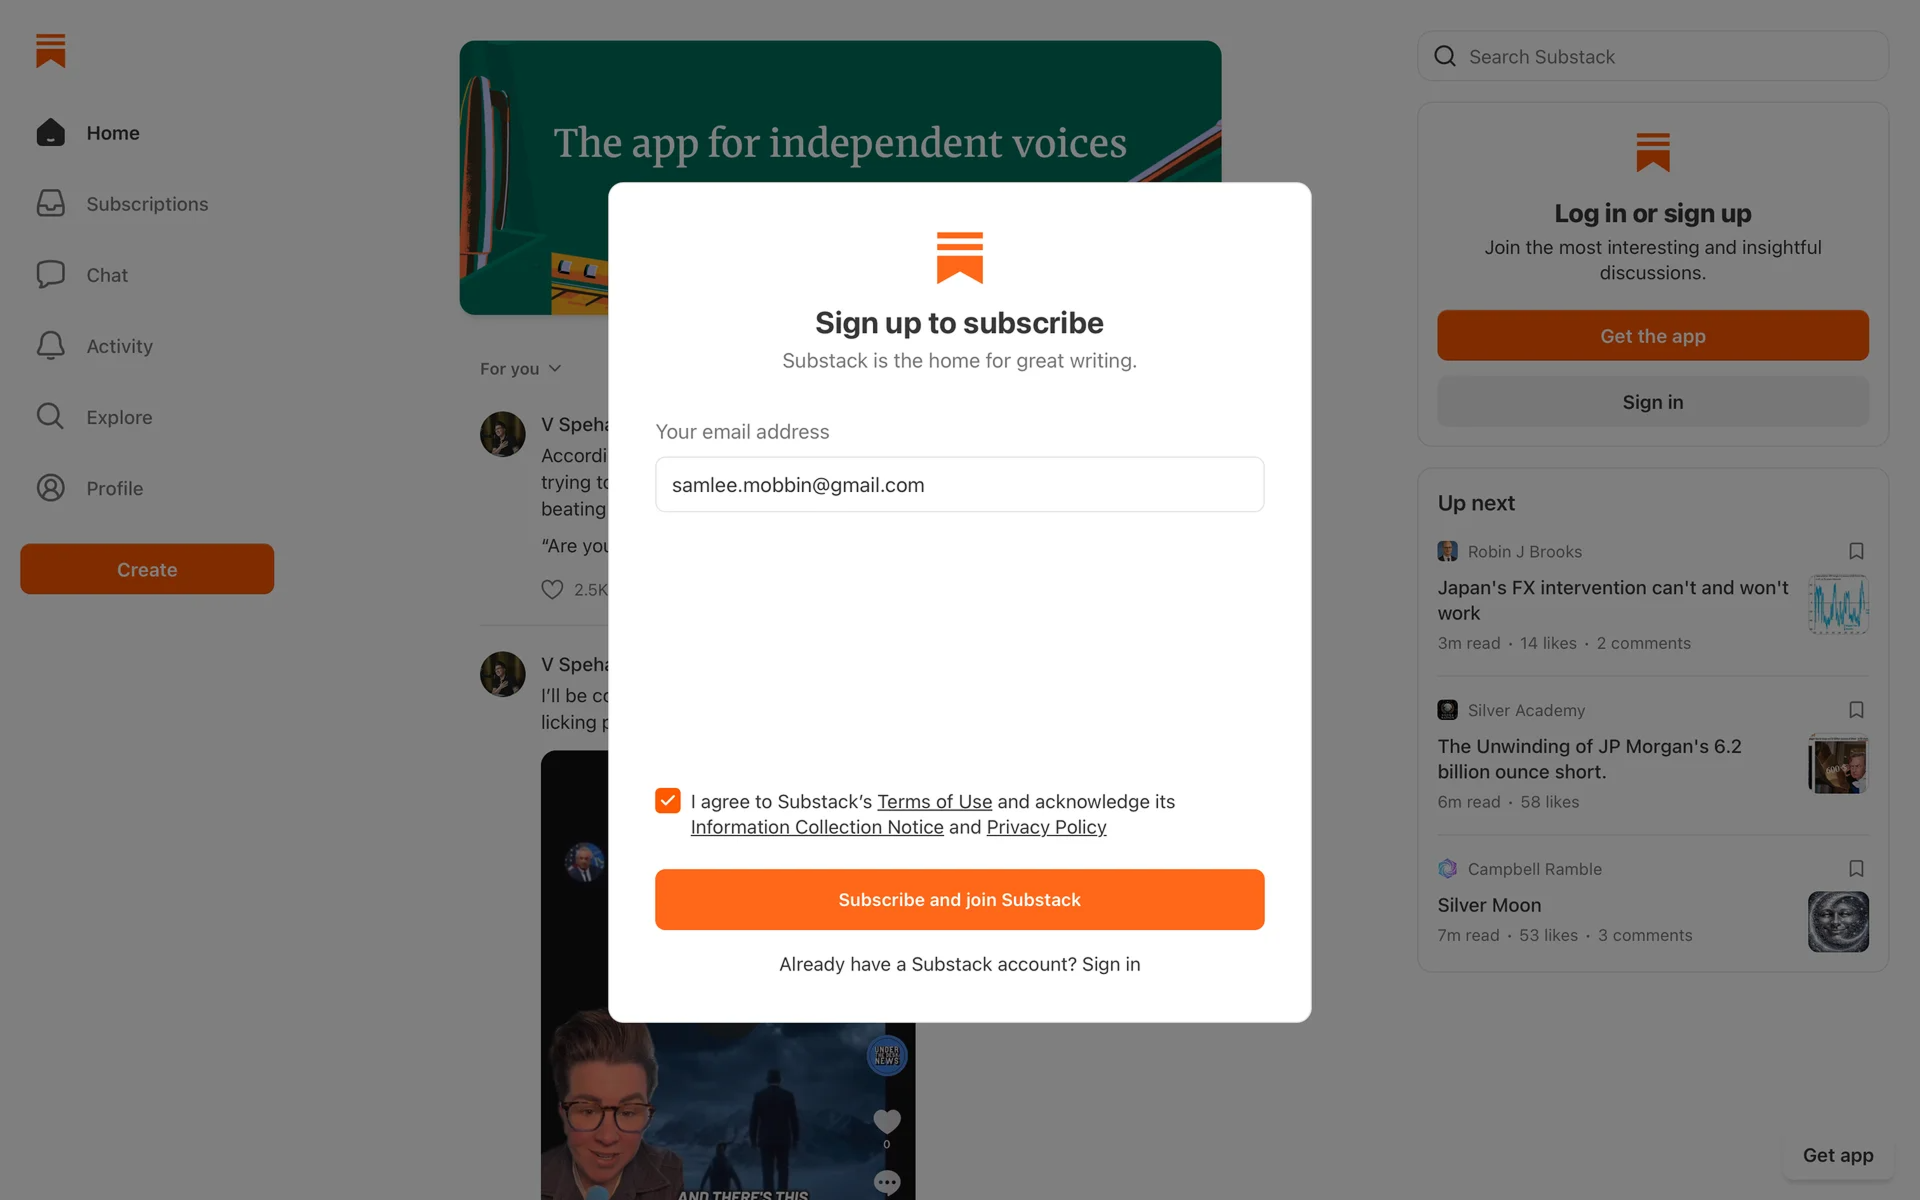
    Reviews 2–10 sequential screens against Nielsen's 10 usability heuristics and rates each issue by severity, task impact and recovery.

    A source screen used in a Flowyce heuristic evaluation

    All data, scores, charts and findings shown in this section are illustrative examples generated for demonstration purposes only. They do not represent actual client results and do not constitute a guarantee of any future performance or outcome.
    Synthetic user testing

    AI personas grounded in what is on the page walk through a flow and log friction, hesitation and drop-off risks.

    The First-Time Visitor avatar

    SIMULATED PERSONA

    The First-Time Visitor

    Friction score

    65

    High friction

    Est. time

    1 minute

    Stall points

    4

    Friction level65%

    FRICTION DIMENSIONS

    What this persona experienced

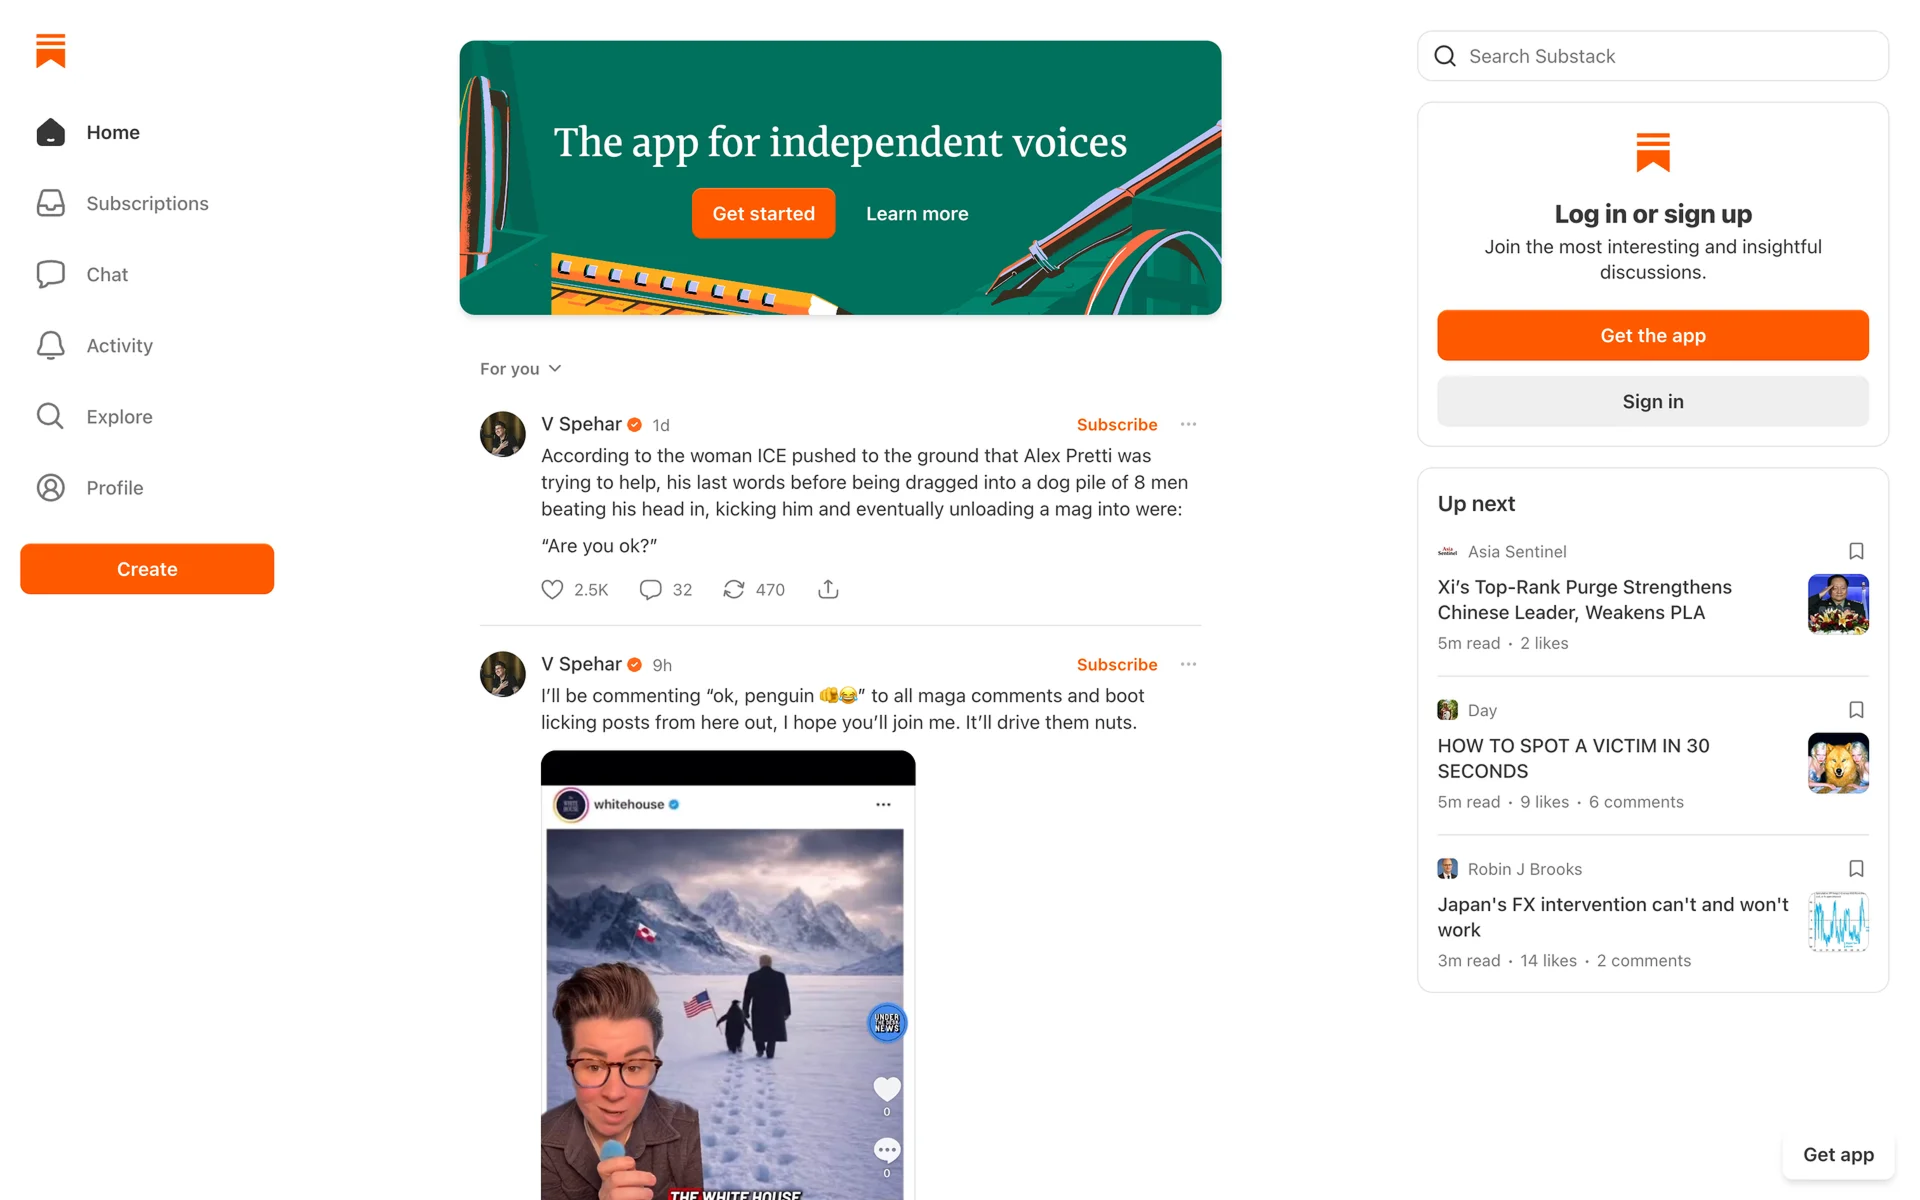
    The purpose of the feed was unclear, and several competing sign-up actions created hesitation.

    Evidence grounded in the supplied screen and visible interface content.

    All data, scores, charts and findings shown in this section are illustrative examples generated for demonstration purposes only. They do not represent actual client results and do not constitute a guarantee of any future performance or outcome.

    Journey mapping

    Maps each step of a flow with an emotional arc so you can see where confidence rises or falls.

    NINE-STEP FLOW

    Onboarding journey map

    STEP 1

    Find signup
    Onboarding landing page with several competing sign-up prompts

    TASK

    Scan the homepage

    THOUGHT

    “Which sign-up button is the right one?”

    FEELING

    Confused by competing CTAs

    OPPORTUNITY

    Consolidate prompts into one primary CTA

    Step 1 of 9

    All data, scores, charts and findings shown in this section are illustrative examples generated for demonstration purposes only. They do not represent actual client results and do not constitute a guarantee of any future performance or outcome.

    How it works

    From URL to prioritized fixes

    1. 1

      Add a URL or screenshots

      Use a public URL, or upload mobile and desktop screenshots for gated or in-progress pages.

    2. 2

      Review evidence-backed findings

      Every issue links to what was observed, why it matters and how confident the analysis is.

    3. 3

      Prioritize and share fixes

      Move findings into an effort/impact matrix and share a read-only report with your team or client.

    What you get

    A scored audit with the evidence attached

    Category scores, ranked recommendations and the captures the AI actually reviewed.

    UX SCORECARD

    Broad review result

    77th percentile · SaaS

    OVERALL SCORE

    73/100

    A strong foundation with identifiable conversion friction.

    Conversion impact projection

    Medium confidence

    CURRENT STATE

    Score73/100
    Est. conversion rate4.5%

    PROJECTED STATE

    Score85/100
    Est. conversion rate4.77%

    Potential conversion-rate lift

    +0.27 pts

    5,000 simulations

    All data, scores, charts and findings shown in this section are illustrative examples generated for demonstration purposes only. They do not represent actual client results and do not constitute a guarantee of any future performance or outcome.

    AI vs manual

    A faster first pass, not a replacement for research

    Use an AI UX audit to find what is worth investigating, then validate the biggest questions with real users.

    AI UX auditManual expert audit
    Time to first findingsMinutesDays to weeks
    ConsistencySame rubric every runVaries by reviewer
    Cost per auditCredits on a $29/month planOften hundreds to thousands
    Real user behaviorSimulated, not observedObserved with research

    Who it's for

    Built for people who audit for a living

    Agencies & freelancers

    • Audit a prospect's site before the first call
    • Turn findings into a clear, prioritized pitch
    • Share a read-only report with clients

    Internal product teams

    • Get a fast first pass before a release or redesign
    • Align design, product and marketing on evidence
    • Decide which fixes to research or build first

    Findings support your judgment; they are not guarantees of outcomes.

    FAQ

    AI UX audit questions

    Run your first AI UX audit

    Add a URL or screenshots and get scored findings in minutes.

    30 days · No credit card